Sampling strategy
He‘eia Fishpond is a dynamic, tidally-dominated system; the physical and biogeochemical characteristics of the pond change as a function of tidal state. During flood tide, the pond takes on the more oceanic character of Kane‘ohe Bay, while freshwater influence on the ebb tide extends sometimes all the way across the pond to the seawall (Timmerman et al. 2014; Young 2011). In designing a monthly sampling strategy, we grappled with how to create a meaningful time series given the substantial variability encountered during different tidal states. Our sampling strategy has undergone a 2-step evolution since the inception of HCOOS in 2007, outlined below. While the first sampling strategy was exploratory, the second is optimized for meeting the objective of building a time series record of pond physical and biogeochemical properties, in which data from samples collected during a given month can be compared to data collected from any other month. The second sampling strategy is in practice today.
Exploratory Phase (August 2007 – August 2008)
During the first year of HCOOS (2007), we characterized the variability of the pond’s physical and biogeochemical state as a function of tidal state by targeting sampling during both spring and neap tides, as follows:

Table 1. Year-1 dates of sampling.
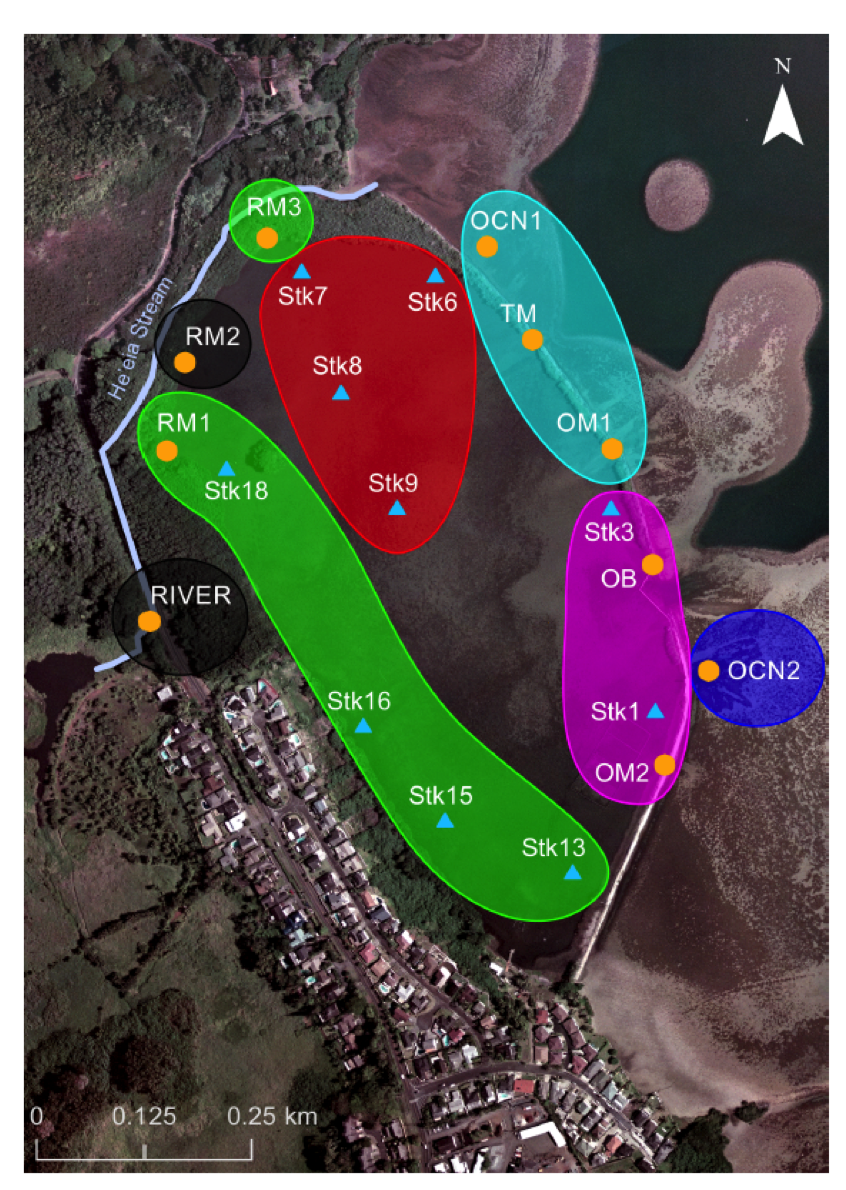
Fig. 1. Spatial distribution of pond areas with similar mean annual salinity, adapted from Young (2011). Black = freshwater, Green = terrigenous-dominated, Red = mid-pond, Cyan = ocean-dominated group-1, Magenta = ocean-dominated group-2, Blue = ocean. See Young (2011) for further description of methods and discussion
Analysis of these data allowed us to examine variability in the extent of influence of the two end-member sources of water to the fishpond, Kāne‘ohe Bay and He‘eia Stream, and the extent of mixing of these two end-members across the pond under different tidal conditions. Grouping sites according to mean annual salinity over this first sampling year illustrates the effective ‘zonation’ of the pond driven by extent of influence of terrestrially-derived fresh water versus saline bay water (Young 2011, Fig. 1). Although valuable for understanding the extent of variability of pond physical and biogeochemical characteristics as a function of tidal state, the first year of data collection convinced us that sampling each month at the same tidal state would be a more optimal for generating monthly comparable monthly data.
Optimized Sampling Strategy (September 2008 – present)
Because profiling and discrete sample collection at all sites within our sampling grid requires between 2-3 hours, it cannot be accomplished within the time constraints of a single tidal state. In order to minimize variability of tidal state during each monthly sampling effort, we now always target neap tide for sampling, so that differences between ebb and flood tide are minimized (Fig. 2).

Fig. 2.Time interval of a typical monthly sampling highlighted in red, showing that is occurs partially during flood (blue-shaded areas) and partly during ebb (green-shaded areas) tide. The minimum difference between ebb and flood tide occurs during a neap tide. Tide chart provided by Mobilegeographics.com under Mokuoloe, Kanehohe Bay, Oahu Island, Hawaii Tide Chart.
Spatial coverage
During our first year of sampling (2007), we covered an extensive sampling grid in order to characterize the degree of spatial variability of pond physical and biogeochemical characteristics. This sampling grid included all makaha, ten stake locations (1, 3, 6, 7, 8, 9, 13, 15, 16 and 18), He‘eia Stream (River), OCN1 and OCN2, for a total of 20 sampling sites (Fig. 3). Analysis of annual average salinities at each sampling site within the grid during the inception year of HCOOS (2007) allowed us to identify discrete areas within the pond that were spatially (statistically) indistinguishable (Fig. 1). This information allowed us to construct a more streamlined monthly sampling effort, which targets a single stake within each zone. We continue to sample all makaha and the 2 sites outside the seawall (OCN1 and OCN2). Sampling of the RIVER site has become logistically difficult; we are in the process of selecting a new site that will capture the terrestrial end-member previously represented by the RIVER site shown in Fig. 3.
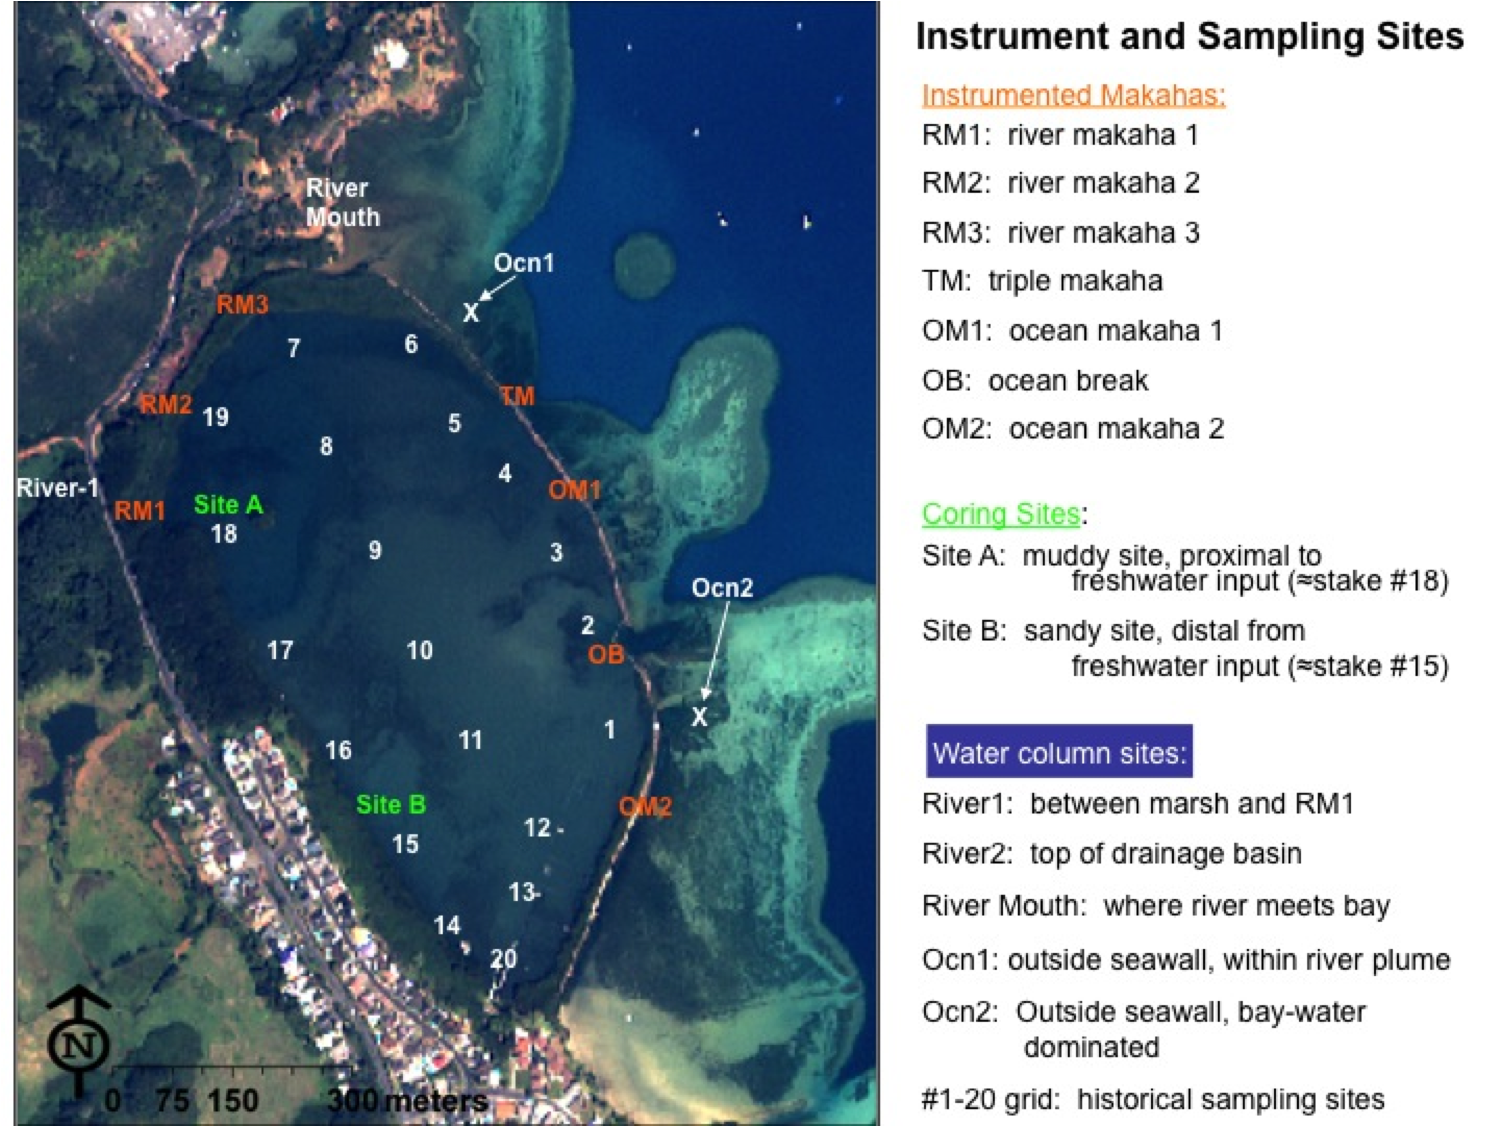
Fig. 3. Full sampling grid from HCOOS inception year (2007).
Mākāhā samples are taken within the mākāhā channel; for TM, only the northernmost makaha is sampled. Pond (stake) samples are taken both at the surface (upper 25 cm) and near the bottom (25 cm above bottom). The River sample is taken mid-stream.